Showing posts with label OBIEE. Show all posts

Monday, November 22, 2010

Easy Download Link

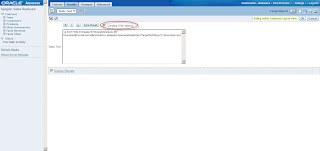
When setting up a navigation from a report on a dashboard to a target report (not on a dashboard), one of the pieces missing and most asked for is a download link. To provide it, follow these simple steps.

1. Open the report that should contain the download link
2. Add a static text view to the compound view

3. Check the "Contains HTML Markup" checkbox
4. Type:


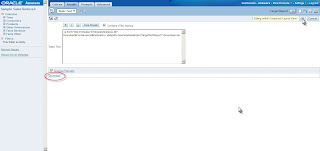
5. Click the "Display Results" link to verify it is working then click ok
6. Test it

Syntax:
http://virtualxp:9704/analytics/saw.dll? - the path to the BI Server (typically /analytics/saw.dll is all that is needed)
Download - the action to perform (other actions include Go and Navigate, not covered in this post, maybe next time)
&Format=excel - the format of the download
&Extension=.xls - the extension of the file (the report name will be the file name)
path=/users/administrator/Target%20Report - the path to the report

The path to the report can be found in the address bar.
If you are manually typing it in or providing it through a column value, don't forget to replace spaces, quotes, and other special characters with their HTML equivalents.

Other valid formats and extensions:
CSV - &Format=txt&Extension=.csv
PPT - &Format=powerpoint
Excel 2000 - &Format=excel2000&Extension=.xls
HTML - &Format=mht

Wednesday, June 2, 2010

BI Apps Performance Optimization and Consideration - Part 3

In this last part we will look at other options of optimizing the performance of OBIEE


Aggregation Strategy


  • Multi-level (pyramid) aggregation strategy: level 1 to level 2, level 2 built on level 1

  • Incremental aggregation for level 1 aggregates to reduce ETL time

  • Level 1 aggregates can be at the lowest leaf of each dimension to avoid bulk re-aggregation when dimension hierarchies change (e.g. sales force re-organization, product hierarchy changes)

  • Bulk aggregations for higher levels for simplicity

  • Data compression drives aggregation (at least 10 x, preferably closer to 100x). This could be implemented for Service Request tables

  • Try aggregation based on dimensions instead of factsAggregation to the ratio of 50:1

Caching Strategy


  • Proper caching strategy needs to be implemented as this is among the best practice of optimization . Caching must be implemented based upon users by groups

  • Set the physical table cache property on Mater table not aliases

  • Set cache persistence time based of refresh schedule

  • Ideally do not opt Cache never expires in the physical table properties

  • Caching logs may be monitored for user sessions and queries may be analyzed across various users to optimize

  • Use ODBC extension functions to purge cache which has the following advantages

  • Analytics Cache Purge ODBC Extension Functions

  • ETL routines can proactively call ODBC extension functions to manage cache. This ensures that obsolete cache is purged as soon as possible

  • Purging Cache by Logical Query is a new capability. This will be particularly helpful in purging cache associated with logical queries that are used in Cache Seeding.

  • Purging the entire cache set in one command is a new capability that can be used in various scenarios including development and testing environments.

  • SAPurgeCacheByQuery will purge a cache entry that exactly matches the logical query plan derived from a specified query. This function takes one, and only one, parameter representing query text. USE_ADVANCED_HIT_DETECTION. The default value is NO which will have the pre-existing cache hit detection behavior. The value YES will invoke the two pass algorithm which will examine a greater search space and is potentially more expensive than the default behavior. you should set the value to YES when you wish to maximize the number of cache hits they obtain

    Check the following Cache for scalability

Browser Cache
Scripts like Java or HTML
High resolution images
Data Access
Query Plan cache
Multithreaded Database Pools

BI Server Cache
Result Set
Aggregations
Summaries


Database Optimization


  1. Database archive strategy


  • The data in the databse needs to be archived from time to time in order to manage the data size. The idea is to keep only a certain amount of data in the warehouse and archive the rest of the data. For example, keep only the last 12 months of data in the warehouse, and archive older data from the warehouse.

  • This database archive strategy will help limit the number of rows across tables with huge data

2. Database Partition strategy


  • A good database partition strategy will help query performance since the query will only need to look at a specific partition to obtain the result. For example: The Organization table can be partition based on Active Flag ; The Service Request table can be partitioned based on X_CALC_FLG = 'Y’

3. Database Indexes


  • A database index should be added for the most queried columns. The database index should also be rebuild from time to time to ensure its effectiveness. ALTER INDEX MONITORING USAGE command that collects statistics over a period of time.

  • Increase Parallel Query by configuring the database server for an optimal degree of parallel processing.

  • Given sufficient resources, this can greatly improve query

  • Make sure that cost-based optimization is enabled on databases

  • Set the tablespace to at least the same as the transactional database size. Make sure the temporary tablespace has adequate space

  • Create histogram statistics for these indices to enable the optimizer to better perform queries on critical tasks

  • Spread data across multiple disks. RAID Redundant Array of Independent Disks configuration if possible is recommended

  • Partition Large fact tables like Asset, SR is recommended

  • Set the number of log file groups to 4 on Warehouse schema

  • Set the size of each log file to 10 MB. on warehouse db

  • Set the sga_max_size to 700 MB or more

  • On the client side, edit the tnsnames.ora file. Modify the TNS alias by adding SDU= and TDU=as follows:
    myhost_orcl.world=DESCRIPTION=(SDU=16384)(TDU=16384)
    ADDRESS = (PROTOCOL = TCP)(HOST=myhost)(PORT=1521)) CONNECT_DATA=(SID=ORCL))

  • On the Oracle client Set the NLS_SORT parameter to BINARY

  • The ETL implementation team should use analyze table commands specific to their database environment, that can be executed after the respective session has completed. This can be achieved by using the post-session command property of each session
    Try to break up ETL processing so data is extracted and staged remotely then compressed for further local processing

  • Remote ETL servers extract and stage to local flat file, compress and send the flat file to central ETL server

  • Central ETL Server performs the ‘stage to data warehouse’ process

  • Manage I/O Traffic --> Manage the input and output accesses to disk storage by striping the disk storage. The best and simplest action is to install disk storage arrays (RAID), the second best is to stripe volumes using a Logical Volume Manager.

  • De fragment tables to which the data is extracted

  • See how much memory is on the available server and set the values for SORT_AREA_SIZE and SORT_AREA_RETAINED_SIZE rather high. 20, 30 or 40 MB per session is not uncommon in a data warehouse situation. Also set HASH_AREA_SIZE rather large

Infrastructure Options


  • Consider deployment options on separate hardware for various OBI components like BI Publisher, OBI Server, OBI Presentation Services, Oracle Delivers Server

  • Hardware must be available based of the recommendations from Oracle. The hardware for database must be must also be setup based of the size of the database

Friday, March 26, 2010

Which Tool Should Be Used for Reporting?

My clients often wonder which Oracle tool they should use for reporting, building graphs, and generating dashboards. It’s a great question because, as anyone in this realm knows, there are many different options. This blog will touch on the three reporting tools I’m familiar with: Financial Reporting Studio (FRS), Web Analysis (WA), and Oracle Business Intelligence Answers (OBI).

One caveat here is that the bulk of my experience comes from the Oracle Hyperion side, so I have much more familiarity with FRS and WA, and definitely less so with OBI. So, this blog will be written from that perspective.

Below, I’ll give a synopsis of what each tool does, based on my experience, followed by my opinion of when each should be used.

Financial Reporting Studio
FRS is a great tool for producing regular reports, like a monthly reporting package. It allows you to create production level reports with a multitude of formatting options. FRS reports can be viewed in PDF or HTML format, from a client component or over the web. Reports can be gathered together in Books and batch scheduled to run at the frequency of your choosing, and then saved to a particular location or emailed out to a list of users.

FRS is not a tool for producing dashboards, is limited in its chart and graph functionality, and would not generally be used for ad-hoc reporting.

Web Analysis
WA comes from the Hyperion suite of products as the tool for building dashboards. In my experience, it’s most often used to create quick snapshots of data for management or executive level users. WA allows you to create multi-view looks at your critical business metrics, either in graphical or grid format. For example, a dashboard might include a line graph of sales by region in one quadrant, a bar chart of sales by VP in another quadrant, a pie chart of expenses by category, and a grid showing spending by department. WA includes traffic lighting as a feature, allowing you to highlight or color significant variances of data.

WA would not be used for production reporting.

Oracle BI Answers
OBI Answers is a tool for building both reports and dashboards from a variety of sources including relational and multi-dimensional databases. You can build similar dashboards to what WA offers and publish reports similar to what FRS offers. The entire OBI suite has pre-built modules by industry that allow for easier implementation depending on the particular business case.

While OBI Answers can use Oracle Essbase as a data source, there are some issues in doing so that prohibit the use when a particular hierarchy exists. This should be addressed in an upcoming release, but at this point, the OBI link to the Oracle Hyperion suite of products is very limited.

Which Tool?
So, which reporting tool should be used when? With the current releases and functionality available, here is how I would use them:

FRS – Use for regular production reporting such as income statements, operating expenses, headcount, and any other meaningful financial metrics from an Oracle Hyperion data source such as Essbase, Planning, or Financial Management. I generally don’t create charts and graphs using FRS because the options and functionality are fairly limited. But, if you have fairly straightforward and simple chart requirements, then FRS should work fine for you.

WA – I would use Web Analysis for producing grid and chart dashboards from an Oracle Hyperion data source. WA does a good job of incorporating “bells and whistles” that make a dashboard “pop”, providing important metrics quickly.

OBI Answers – OBI is a great tool to use to quickly build reports and dashboards from a data warehouse. In my opinion, this is the easiest tool to learn and use of the three. As I mentioned above, I don’t think it’s currently the right tool to use with Oracle Hyperion data sources, but that very well could change in the near future.

Going Forward
In future releases, I think that OBI will become the tool of choice for reporting and dashboarding, even for Oracle Hyperion data sources. Oracle is very good at creating synergies between their product lines, and while each individual application generally has their own set of tools, eventually, they converge to similar toolset technologies. I think as OBI gets more integrated with the Oracle Hyperion suite of products, it will become the tool of choice for reporting. In my opinion, it is easier to both learn and use compared to both Financial Reporting Studio and Web Analysis.
Monday, January 25, 2010

BI Apps Performance Optimization and Consideration - Part 2

This is in continuation to the earlier posting. We would now look at some recommendadtions for OBIEE Repository(Metadata), Reports and Dashboards and Presentation Catalogs

Repository

· Analyze the driving tables and nested loop joins
· Analyze the SQL if using any view object definitions in the physical layer
· Consider the possibility of complex joins in the physical layer
· Analyze the possible usage of Inner, Outer, left inner
· Consider usage of aggregate tables and model the rollups in the logical layer thus avoid detail tables as and when required
· Analyze the aggregate tables so that they do not combine multiple levels of aggregation instrad put each level of summarization within its own table
· Consider subset large physical dimension tables creating mini dimension tables but this must be done by identifying the family of queries that fall within the subset table
· Consider use of filters than CASE statements in rpd
· Manage cache and analyze if any stale queries are generated
· Evaluate possible cache purging methods
· Evaluate design
· Create additional aliases to avoid circular joins for dimension tables that are joined to more than one or other table
· Use canonical time dimension
· Use multiple time dimensions for each level of granularity
· A single logical time dimension may be modeled having many LTS’s of physical time dimension aliases

· Increase the max number of connections per connection pool based on need only
· Possibly do not use opaque views
· Validate proper logical level settings at the content tab for confirmed model
· Validate the metrics aggregation rules as when the metrics are created using logical columns then the aggregation rule need to be applied before and similarly when the metrics are created using the physical columns then the aggregation rule must be applied after creating the metric
· Use estimate levels to set the number of elements for each dimensional hierarchy level

Reports and Dashboards

· Recommended to split their reports based out of data level visibility. Now that a dashboard is with all data across all users. splitting with data level security model enhances performance as it restricts users with limited data at query level
· Must implement data level filters across dashboards to restrict data on dashboards that require significant scrolling and navigation
· To help users to locate their data in which they are interested organize dashboards by user role
· Home dashboard page might have only summary level reports and create a guided user navigation linked reports to facilitate users to drill to details
· Also you may create data driven drill through reports on summary to navigate to detailed reports of hierarchy
· Use conditional formatting to focus attention on data that is outside given parameters
· If the columns that are included in a report use web variables or carry only filter criteria, then hide these columns
· Direct users to other analysis based on how their dashboard appears at that moment
· Search and destroy all excluded column in pivot views across reports
· It is observed that pivot table views are being used across many reports. It is recommended to avoid using pivot views as far as possible
· Try to increase values for and parameter to override maximum number of records that can be processed by a pivot table
· Prune repository and web catalog to requirements
· For a table view just in case you want to increase Rows of data beyond 65000 then change parameter in instanceconfig fileVIRTUAL_TABLE_PAGE_SIZE in NQSConfig.ini file can be increased to 256

Presentation Catalogs

· Try to stay to the rule of 7, i.e. 7 top level folders and 7 columns per folders
· Create subfolders under relevant folder section
· When there are many fact tables within a presentation catalog then assign an implicit fact table

In the next part we will see the techniques for aggregation, caching, database optimization

Tuesday, January 12, 2010

Video: Maximizing Oracle Business Intelligence Adoption: Amway and LCRA


A customer panel at a recent conference analyzed different approaches to maximizing user adoption for Oracle Business Intelligence. Business Intelligence Consulting Group moderates this customer panel, which features representatives from Amway, Lower Colorado River Authority (LCRA), and BICG.

Thursday, December 31, 2009

BI Apps Performance Optimization and Consideration - Part1

This topic may be used at a high level but covers most of the common aspects of the performance tuning and optimization considerations for OBIEE deployments. This topic does not detail much about handling ETL performance tuning. Couple of points are picked from Oracle's recommendations

At a high level the following needs to be reviewed and analyzed

  • Data model and custom star schema's
  • Physical Layer (including Joins and Keys configured)
  • Business Model and Mappings Layer (including Joins and measures defined)
  • Presentation Layer Layout
  • Application Performance (including Joins, and aggregate tables configured)
  • Caching options configured
  • Security and Personalization
  • Initialization Blocks and Variables configured
  • Investigate the use of aggregate tables and mini dimension tables to increase performance
  • Define data archive strategy and table partition strategy to manage data sizes in the database
  • Database optimization
  • Hardware setup

Partitioning

  • Consider partitioning large Fact tables having more than 20 million rows
  • Identify eligible columns of type DATE for implementing range partitioning
  • Connect to the Oracle BI Server repository and check the usage or dependencies on each column in the logical and presentation layers
  • Analyze the summarized data distribution in the target table by each potential partitioning key candidate and data volumes per time range, month, quarter or year
  • Basing on the compiled data, decide on the appropriate partitioning key and partitioning range for your future partitioned table
  • The recommended partitioning range for most implementations is a month, though you can consider a quarter or a year for your partitioning ranges

The following columns may be considered as partitioning keys


W_AP_XACT_F on POSTED_ON_DT_WID
W_GL_ACCOUNT_D may be a Date WID
W_AR_XACT_F on POSTED_ON_DT_WID
W_GL_REVN_F on POSTED_ON_DT_WID
W_GL_COGS_F on POSTED_ON_DT_WID
W_TAX_XACT_F on POSTED_ON_DT_WID
W_GL_OTHER_F on ACCT_PERIOD_END_DT_WID

Storage Considerations for Oracle Business Analytics Warehouse

  • Setting excessive parallel query processes
  • Running multiple I/O intensive applications, such as databases, on a shared storage
    choosing sub-optimal storage for running BI Applications tiers
  • Make sure you carefully plan for storage deployment, configuration and usage in Oracle BI Applications environment
  • Avoid sharing the same RAID controller(s) across multiple databases
  • Set up periodic monitoring of your I/O system during both ETL and end user queries load for any potential bottlenecks
  • Update optimizer statistics
  • Consider implementing Oracle RAC with multiple nodes to accommodate large numbers of concurrent users accessing web reports and dashboards
  • Check for the database configuration parameters as per the recommendations specified in the install guide

Managing Slow Running Reports

  • Analyze the session SQL
  • Run Trace or Explain plan on query
  • Analyze the logical joins leading to the slow performance
  • Analyze the database
  • Increase the log level to 5 and analyze NQLQuery.log file and look at Query string,
    Logical request, Physical SQL query, Query outcome status, Physical query response time, Rows returned to client
  • Key approach should be to address performance issues as close to the data as is possible, moving processing down the stack to the data

The next part will be about handling performance at metadata, reports & dashboards, presentation catalogs

Wednesday, December 16, 2009

Oracle partners with BICG on BI Applications Hands-on Workshop

Pleasanton, California - December 09, 2009

BICG partnered up with Oracle to conduct a hands-on Oracle Business Intelligence Applications workshop for Oracle clients.

Oracle provided the meeting-space, latest and greatest view of the technology, and business value gained when implementing the technology presentation. This allowed all attendees to see first hand what is happening and what is coming. You had to be there!

As the only recipient of the coveted Oracle BI/EPM Partner of the Year designation in association with the Oracle Innovation Awards at this year's Oracle OpenWorld, Minneapolis based BICG was selected to provide the "hands-on" training. BICG has long been recognized as a top performer when it comes to executing "experience based" success in both product training and project design, development and implementation. BICG was also presented to the group on "Developing a Corporate Business Intelligence Strategy". The presentation directly addressed potential pitfalls and recommendations surrounding Business Intelligence projects. BICG chose 30 year BI veteran Steve Tinari to lead the training and make the BI Strategy presentation.

Registration for the workshop was required and limited to 40 seats. This is all the space there was in the meeting room. Registration was sold-out in days and a wait-list was quickly developed. Last look had 25 clients waiting to claim a seat.

BICG has been asked to continue conducting this hands-on Oracle BI Apps workshop at strategic locations across the US and abroad. Registration for upcoming workshops can be found at http://www.biconsultinggroup.com .

BICG Workshop Advice: register early for the upcoming events and don't forget to bring your laptop. BICG uses a virtual training method that allows you to connect to their environment using only a web browser!

Monday, November 30, 2009

Real World Analogies in OBIEE

As OBIEE emerges as a cornerstone part of Oracle’s Web 2.0 Fusion offering, it is a good time to discuss a real world analogy that has been apparent to me for many years now and has generated excitement during planning sessions of the more innovative implementation teams I’ve been on. OBIEE is an excellent web tool, for its dashboards and navigations, and it is important to look at User Groups as a cohort of individuals with shared goals who need to use OBIEE as a communications tool and as an effective analytic tool. A tool that has been useful in the real world for doing this is the fantasy sports league application, and it gives us many valuable insights for achieving uptake in our OBIEE implementations.

Although it is ironic that an application with the word “fantasy” in its title would be a useful analogy to solve our business problems, it is still true. Fantasy sports leagues have been very successful in the real world as an analytic tool that has had mass uptake. The application needs to be effective in helping groups to complete their assigned work, and to make better decisions, which are both key goals of our OBIEE implementations. Fantasy leagues are used as a communication vehicle for real world business groups that are looking for ways to interact, such as a college cohort looking to stay in touch after graduation, or a company contest. The value of contests as a business tool for generating ideas is well documented. Google’s programming contest, which started in 2002 has generated tens of thousands of applications, is responsible for important real-world systems like Google Local and Professor-Verifier [The Google Way, Chapter 7: Look for Ideas Where They Are, Bernard Girard, No Starch Press 2009].

The history of the fantasy leagues, more than thirty million strong today, is curiously analogous to what we want to achieve with OBIEE. From 1960 to 1980 it was a tool used by the intellectual elite, like Harvard Sociology Professor William Gamson’s “Baseball Seminar”. Rotisserie leagues started getting media attention in 1980, and special notice was given to the fact that data was used in real time, statistics from the current season. The business of statistical analysis matured in the fantasy sports field after its popularity created a demand for optimized predictions of specified Key Performance Indicators that scored points in the leagues.

Fantasy sports as a web application online is currently used by over 30 million people, creating competition for the best analytic dashboards to attract the most users.

So what do analytic dashboards used by these fantasy leagues look like, and how can we do that in OBIEE dashboards? While graphs may be important, note that for the masses these graphs are not extremely useful. Tabular lists dominate fantasy sport websites. The lists must default to the most useful Top-N and be re-sort-able by column. This is a common feature of tabular reporting in OBIEE, but it is important to understand that in the real world, other more graphic features do not undermine the importance of putting our data in this fashion on dashboards. The ability to quickly navigate from one presentation of data to another presentation of data with the same visual representation, a tabular, re-sortable presentation, is the dominant feature. Visual keys, surprisingly, are most useful when they simply give us more information on that representation. For example, ESPN has a Top-N page of multiple major categories, and the graphic is simply a photograph of the face of the top person in that category. In OBIEE, it might be useful to expose more photos of our business individuals, such as the business owner responsible for the dashboard. If it were a KPI were measured by team performance, a team logo might be useful. More sophisticated analytic tools are for a different audience, and follow the needs of the statistical analysts who are part of smaller decision teams, so they do not get exposed on the dashboards used by most of the people who consume the application. This might be an equivalent of a text alert on the screen that aggregates the number of Monte-Carlo simulations that were done, but exposing details of the thousands of simulations would not be possible.

BI Applications in 7.9.6 already have done some good work in providing a user experience. We just have to pay careful attention about how to implement the system. For example, built into the out-of-the-box experience are two sets of dashboards. The set of dashboards that is used by most people has the common presentations similar to fantasy leagues, such as the Top-N type of presentation. When you see demos of the tool, they default to the graphics, but there is a view selector that allows tabular lists of the data, and I would suggest considering in most cases whether the default presentation when coming on-screen should be tabular to reduce clicks and increase usability. The other set of dashboards spans multiple subject areas. These are pre-built statistical analyses available for when decisions need to be made upon the data, and include scatter charts, regressions and tools common to a smaller audience, the more sophisticated decision analysts.

Another question I have been asked in OBIEE implementation discussions is whether a contest for who uses the dashboards the most is possible. This would be analogous to the fantasy sports league itself. The answer is that it is very possible, in fact we do monitor usage in the OBIEE implementations, and more sophisticated applications are already developed. BIConsultingGroup’s product IMPACT gets more sophisticated reporting out of the usage of the end users. A dashboard could be designed and written with the specific intent of making a usage contest out of the usage analysis information, with the key business interactions as the key performance indicators. For a more comprehensive analytic application, the design could integrate an application similar to a fantasy league draft, where draft results for units in the sales pipeline could provide interesting information about predictions about which sales in the pipeline have the best chance of success.

What are design teams responsible for? Blogger Jeff McQuigg writes, “A BI system is a well thought out, planned and coordinated collection of efforts designed to produce a system that is so well organized it allows your user community to ask sophisticated questions of it and get those answers quickly and with a high degree of accuracy.” Fantasy leagues provide us with a successful real world analogy that we can use for building great OBIEE dashboards.

Wednesday, November 11, 2009

Using Smart View with OBIEE - Part 2

This blog post is the final post in a two part series. The first part of the series on how to use Smart View with OBIEE can be found here. To continue with the example in this post you will need to have properly connected to your Oracle BI Server as outline in Part 1.


After completing Part 1, You should have:


- Accessed Smart View

- Connected Successfully to your OBI Server

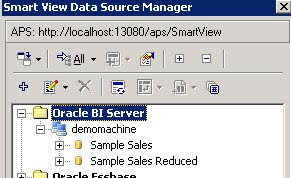
- Have your data source manager set-up similar to this screenshot


Create a Smart Slice


Expand the "Sample Sales" schema.


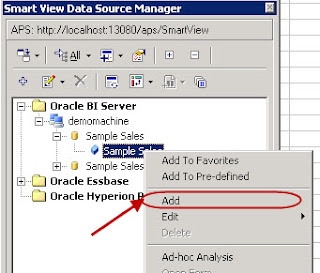
Create a Smart Slice

Select "Add"

(This will start the Smart Slice creation process)


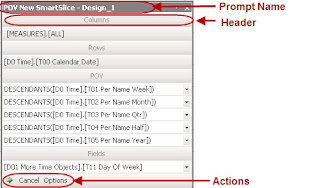
Once your “Add” selection has been made the open worksheet is modified with a rows/columns intersection and a Smart Slice POV prompt. This is the Smart Slice creation mode where you define your analysis criteria and will eventually save it for later use. Notice that the row and column members are at a high-level. At this point we need to select a more granular set of data for analysis.


In the POV prompt (see image below) we are able to select the members that actually build out the grid rows and columns as well as the POV for which no members are actually shown on the grid but are integral to the data slice that we want to conduct our analysis with. When we are ready to select this criteria simply double click on a member. Also to move a member from POV or from rows to columns, simply select the member then drag and drop it into the desired location.


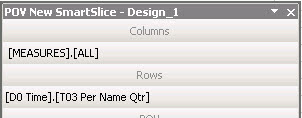
Move DESCENDANTS([D0 Time].[T03 Per Name Qtr]) from under the POV header in the POV prompt so that it rests under the Rows header. Now move [D0 Time].[T00 Calendar Date] from underneath the Rows header so that it rests under the POV header.


Under the Fields header of the POV prompt, find [D1 Customer].[C1 Cust Name] and select it. Now drag the [D1 Customer].[C1 Cust Name] from underneath the Fields header so that it rests underneath the Rows header.


At this point the very structure of our sample Smart Slice example has been created. However, as you can see from the worksheet rows and columns, the current selections are seeking to retrieve the DESCENDANTS of our tabular grid, this would be a huge retrieval of data and we do not want that. We want to build out a more granular slice of data and we do that by conducting the following operations all by using the POV prompt.


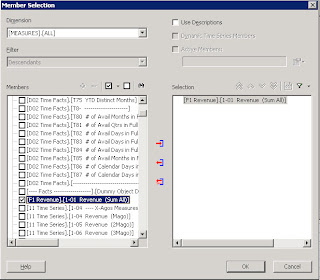
Double-click [Measures].[All] under Columns in the POV prompt.


Select the following measure [F1 Revenue].[1-01 Revenue (Sum All)] by using a combination of the checkboxes and the arrows in the middle of the two large pick-list columns.


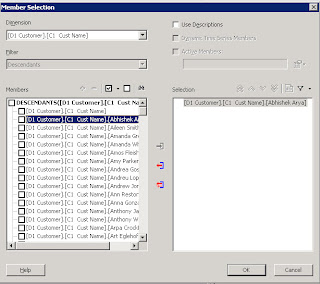
Double-click [D1 Customer].[C1 Cust Name] under the Rows POV prompt.


Select the following measur [D1 Customer].[C1 Cust Name].[Abhishek Arya] by using a combination of the checkboxes and the arrows in the middle of the two large pick-list columns.


Double-click [D0 Time].[T03 Per Name Qtr] under the Rows header in the POV prompt.


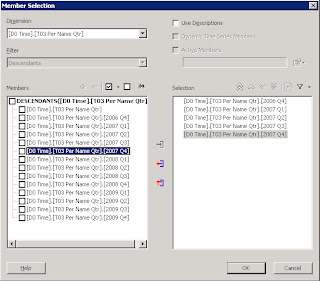
Select the following measures [D0 Time].[T03 Per Name Qtr].[2006 Q4], [2007 Q1], [2007 Q2], [2007 Q3], [2007 Q4] by using a combination of the checkboxes and the arrows in the middle of the two large pick-list columns.


Your final grid should appear as follows.


Right now, the Smart Slice you have been modeled but not confirmed. To begin saving the Smart Slice, click the green arrow toward the bottom-left of the POV prompt.


You may be prompted to review the Member Selections made. If so, just click the “OK” button.

Next, the Smart View Data Source Manager will open a field which allows you to enter a name for the Smart Slice you have just created. Enter a “TestSmartSlice” (1) in the field then click the green (yin-yang-like) arrows (2) to save it.


After the Smart Slice has been saved, it is immediately visible in the tree.


Right-click on the smart slice you’ve just created and select “Insert Query Into Report”


The Report Designer appears. Click the Insert button and select Function Grid.


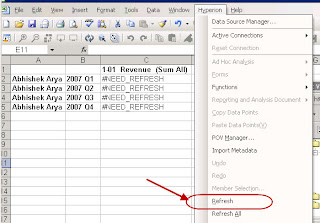
A tabular representation of the model you built out for the smart slice now appears. The #NEED_REFERESH value underneath the measures column tells us that we need to hit the REFRESH button in order to run the query to get data. We do this by using the Hyperion file menu dropdown and selecting Refresh.


The results of the retrieval are shown in the worksheet and we have successfully retrieved data from the Oracle BI Server using SmartView and a Smart Slice.


Conslusion


This example is very basic but it introduces you to the concept of conducting analysis of your Oracle BI data outside of Answers. Using smart slices allows reusable analysis to be conducted in the most popular analysis tool on the market, MS Excel. Using smart slices also introduces a new level of security that can be achieved for your subordinate users. Using SmartView as an extension of current analysis tools will allow you and your organization to grow your toolset along with the direction that Oracle is going with in Business Intelligence following the Fusion release.