Tuesday, June 23, 2009

OBIEE to Twitter... and Beyond

Have you noticed the extraordinary evolution of Twitter as an entirely unique medium of communication? I have. And I've also been having daydreams (call me an OBIEE geek) about coming up with a simple and brilliant way to create a Twitter feed from a scheduled OBIEE report, using something along the lines of either BI Publisher or iBots. Looking into the Twitter API documentation, I started getting excited by the fact that their API follows the REST protocol which essentially uses HTTP requests and responses for the exchange of data. Wow, I thought, I could use the HTTP Delivery method that is new to OBIEE 10.1.3.4 ! How exciting! (OK fine, I truly am an OBIEE geek.)

So we should be able to try a quick and simple test to send a notification to my Twitter profile upon completion of a scheduled BI Publisher report! Awww, not so fast: BIP's HTTP Delivery option implements the "GET" method -- the REST protocol, and likewise the Twitter API, calls for any data update to be made using the "POST" method. Maybe in future versions of OBIEE we'll be able to configure the HTTP Delivery option, and, who knows, even the parameter/values that are sent. For now, this feature won't work with Twitter.

I wonder what iBots can do for me? Perhaps 10.1.3.4 also added HTTP Delivery to "Destinations"? Argh, no such luck -- I'm sure we'll see something interesting in 11g but until then we're out of luck. But what the heck, let's take a poke at the "Advanced" features... Well isn't that interesting! I can call another iBot, a custom script, a Workflow or -- behold -- a custom Java application! Moreover I can even call one or more of these entities in any combination, both when iBot conditions are satisfied AND when no records are returned by the conditional request. The mind reels! And look at the options I have when calling a Custom Script or Java Program -- in addition to the obvious ability to specify the program itself, but I can also specify whether to pass to this program the results of the conditional report (and what format to use) OR the content itself OR simply nothing at all. Moreover I can send any number of additional custom parameters.


Clearly, with just a little bit of work, one could achieve my original objective by writing a simple Java program that reads the incoming parameters and/or dataset and POSTs the relevant information to the Twitter API.

But the real ramifications are much more profound: By using iBots to invoke Java interfaces into external ERP or CRM systems -- many of which offer a rich set of public Java APIs -- the OBIEE platform can become a powerful and flexible system for an enlightened business to coordinate automated actions in richly nuanced response to the variety of heterogenous data made availble to the user's fingertips by OBIEE. I understand OBIEE 11g is taking active integration between OBIEE and business processes to a whole new level with its Action Framework -- but until then, the Custom Java Program feature gives us plenty of possibilities to chew on.

Now, who's ready to write that Java Twitter interface?

Thursday, June 18, 2009

ETL Server Setup: Major Installation Differences between BI Applications versions 7.9.5 and 7.9.6 on a Windows Environment

The most notable difference when setting up an ETL server by installing BI Apps 7.9.6 is the standalone DAC installer. The DAC download is 180MB and can be found on the Oracle website here: http://www.oracle.com/technology/software/products/ias/htdocs/101320bi.html

The BI Apps 7.9.6 file is only 320 MB now as it does not contain the DAC, and the new version of Informatica with this release, 8.6 Hotfix 4 clocks in at 2.1GB. All of these files can be downloaded from the above link.

The following order of operations should be taken when setting up the ETL server:

  1. Install BI Apps 7.9.6. This needs to be installed on a machine which already has the Oracle BI infrastructure installed, such as a development environment or the ETL server itself if you wish to have a copy of Oracle BI residing there. Similarly to other versions of the BI Apps, this will generate the DAC and Informatica repositories as well as the necessary files in the dwrep folder needed to complete the ETL Server installation. If BI Apps 7.9.6 is installed on a different server than the targeted ETL server, both the DAC and Informatica repository files as well as the dwrep folder will need to be copied over to the ETL server following installation.
  2. Install Informatica 8.6 with Hotfix 4. There are several notable differences with Informatica 8.6 and 8.1.1 installations. Most importantly among them is that the Informatica Repository Service and Integration Service are created after installation through the Admin Console rather than through the installer. This allows for greater flexibility during the install, and can save time if all the necessary database level permissions are not yet setup on your Informatica repository databases.
  3. Install Standalone DAC 10.1.3.4.1. The default installation folder is now ORA_HOME\bifoundation\DAC rather than the OracleBI\DAC folder. There are many great benefits to the standalone DAC installer, as it automates many of the setup steps required of prior DAC versions. The DAC 10.1.3.4.1 installer includes its own JDK, so no need to install this ahead of time. Of the many automated setup steps completed by the standalone DAC the most notable are: The DAC Installer copies the pmrep.exe and pmcmd.exe files from the Informatica server to client folder and sets them up for you in the PATH environment variable. The DAC also configures the INFA_DOMAINS_FILE environment variable for you, and sets the DAC_HOME and JAVA_HOME in the DAC config.bat file. When configuring the DAC you will need to specify the Domain Name and Integration Service name now under Setup > Informatica Servers.

    This posting of differences is not complete and is a brief summary of my installation experiences. If anyone has more to add please leave them in a comment. Happy installing!

Modeling Average Metrics in Aggregate Tables

OBIEE has some excellent features for incorporating aggregate tables into the metadata modeling, and these tables are usually pretty easy to create and populate in the database using simple SQL scripts. One of the only wrinkles I have ever run into involved the need for average metrics along with aggregate tables. This blog posting explains the issues that were encountered and provides a solution.

SCENARIO

Suppose you have the following Fact Table, which represents patient visits at a hospital:


  • VISIT_ID is the Primary Key
  • YEAR_KEY is a Foreign Key to the Year Dimension
  • PATIENT_ID is a Foreign Key to the Patient Dimension
  • CHARGES is the only Fact (metric) in the table currently

Let’s say you need to create two CHARGES metrics for your Answers users:
  1. Charges (represent a sum of CHARGES)
  2. Avg Charges (represents an average of CHARGES per patient visit)

You could satisfy these requirements by creating two metrics in the logical layer of the repository, both mapped to the CHARGES column, with the Default aggregation rules for these metrics set to Sum and Avg respectively. For now, let’s assume you choose this route.

Now suppose you want to use an aggregate table to improve query performance for queries that only utilize the year dimension along with visit Facts. The aggregate table might look like this:


NOTE: (in the above example, there were only 6 records in the original table, so an aggregate table would be trivial, but imagine if the VISITS_FACT table had 6 million rows and your aggregate table reduced the row count from 6 million down to 2).

You could easily use the following query to populate the table above:


Note that I have included a VISIT_COUNT column, which might not have been an initial requirement, but its purpose will soon become apparent.


ISSUES

The above method for creating an average metric in an aggregate table may seem like a good approach, but it falls apart in certain query scenarios. Remember your “Avg Charges” metric? Its Default aggregation rule is set to Avg, and this metric is now mapped to two logical table sources:

  1. VISIT_FACT.CHARGES
  2. VIST_FACT_AGG_YEAR.AVG_CHARGES_PER_VISIT
When you run an Answers request that contains the Year dimension along with the “Avg Charges” metric, the result is correct; however, what if you run an Answers request that only contains the “Avg Charges” metric and nothing else? There’s a good chance that the Oracle BI Server will still choose to use the aggregate logical table source for this query, and if it does, the results will have an incorrectly calculated “Avg Charges” metric. Why is this? It’s because you can’t average an average. Averaging is not an additive operation. When you try to average a group of numbers that already represent averages, you do not get the proper weighting factors of the original averages and the formula is wrong.

In our example, the correct average for all 6 rows would be (100+100+200+200+850+950)/6 = 400; however, the “average of the averages” would be (900+150)/2 = 525, which is incorrect.

SOLUTION

I suppose you could create two separate “Avg Charges” metrics in the logical layer and map each metric to only one logical table source, and then set the content levels for these metrics, but this solution is impractical, overcomplicated, and does not follow best practices. Besides, wouldn’t you rather have just one “Avg Charges” metric available to end users? The backend aggregate tables and processing should be seamless to the end user anyhow, that’s the whole point of the business layer.

Therefore, here is my proposed solution that should still help you reap the performance benefits of using aggregate tables, and will also allow you to define just one “Avg Charges” metric that will have the correct calculation no matter what the query scenario is:

  1. Do not create an AVG_CHARGES_PER_VISIT column in your aggregate table at all.
  2. Instead, create the VISIT_COUNT column in the aggregate table.
  3. In the logical layer, create a “# Visits” metric based on the VISIT_COUNT. Set the Default aggregation rule to Sum (this is the appropriate aggregation rule since counts are additive; here we do not use Count as the aggregation rule because it makes no sense to count a count.) But wait, our VISIT_FACT table does not have a VISIT_COUNT column, so how do we map the “# Visits” metric to this logical table source? Here’s the trick, just map this column to a constant number 1:


    (Think about why this works…counting individual rows is equivalent to tallying the rows by assigning a value of 1 to each row and then summing all the 1’s).
  4. Now that we have a proper “# Visits” metric mapped to both of our logical table sources, create a new logical column for “Avg Charges” using the formula “Avg Charges” = “Charges” / “# Visits” (remember that our “Charges” metric already represents a sum of charges):


  5. No matter what the Answers request looks like, our “Avg Charges” metric will calculate the average correctly, using the appropriate logical table source, and using the following formula, which applies the default aggregation rules in the correct manner: “Avg Charges” = SUM(“Charges”)/SUM(“# Visits”). This formula even works at the most granular level when you are only averaging one row: 100 = 100/1.

This is the best solution I have found for working with averages along with aggregate tables. If anyone has any other ideas, I’d be interested to hear them.

OBIEE Security Enforcement – External Database Table Authorization

Authentication vs. Authorization

Commonly asked question – What is the difference between authentication and authorization? Authentication is the process in which a user id and password is verified to see if the user is a valid user. The process can be compared to logging on to your email or even your laptop. Once the user logs on, authorization takes care of what components or data a user can have access to. To read about OBIEE Authentication click here.

Setting up framework for Authorization

Authorization is most commonly handled by using an external table. The following steps are required after setting up Authentication process:

1. Create a table in the database that would have the Authorization information. If you already have a table from which associates the UserID/Username with Groups, you can use that table. If not, create the following table in your database.

CREATE TABLE WC_USER_AUTH

(

LOGON VARCHAR2(120 BYTE) NOT NULL,

GROUP_NAME VARCHAR2(120 BYTE) NOT NULL,

CREATED_DT DATE DEFAULT SYSDATE

)

TABLESPACE <your tablespace>

PCTUSED 0

PCTFREE 10

INITRANS 1

MAXTRANS 255

STORAGE (

INITIAL 64K

MINEXTENTS 1

MAXEXTENTS 2147483645

PCTINCREASE 0

BUFFER_POOL DEFAULT

)

LOGGING

NOCOMPRESS

NOCACHE

NOPARALLEL

MONITORING;

CREATE UNIQUE INDEX NDX_LOGON_GROUP ON WC_USER_AUTH

(LOGON, GROUP_NAME)

NOLOGGING

TABLESPACE <your tablespace>

PCTFREE 10

INITRANS 2

MAXTRANS 255

STORAGE (

INITIAL 64K

MINEXTENTS 1

MAXEXTENTS 2147483645

PCTINCREASE 0

BUFFER_POOL DEFAULT

)

NOPARALLEL;

2. Now you will have to populate the table with the relevant information. Note that one user can belong to more than one group.

3. Next, you need to create the groups in the repository. The name of the groups should be as they are in the table, if you want these groups to drive web and data security as well. If you have a group called “Power Users” in the table, you would have to create a group with the exact same name.

image

image

4. As a best practice, it is recommended that a separate connection pool is created for the execution of Authentication and Authorization Initialization blocks.

image

image

5. Now create a session initialization block that would read from the table to assign groups to the user.

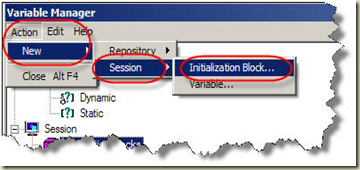
image


image

6. Configure the session initialization block. Give it a name and click on Edit Data Source. In the pop up window, choose Database from the drop down box. Write a SQL statement that would get all the group names of the user that is populated in the USER variable as part of Authentication. The SQL statement used in this example is SELECT ‘GROUP’, R.GROUP_NAME FROM WC_USER_AUTH R WHERE UPPER(R.LOGON)=UPPER(‘:USER’). Choose a connection pool.
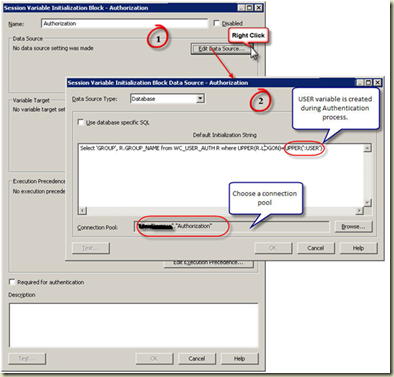
image

7. Now edit the variable target and set it to row wise initialization. What it really means is, it would assign multiple values to a variable, GROUP variable in this case. If a user belongs o multiple groups, multiple rows will be returned by the SQL and this setting would enable GROUP to contain all the values.

image

8. Now set execution precedence. The authorization process takes place after authentication process. We are using a variable (USER) that authentication process is populating.

image

image

9. Now create the Catalog Groups in the presentation services. The group names should match the group names from the table and the repository as in Step 3, if you want them to drive the web and data security.

Go to Settings -> Manage Presentation Catalog Groups and Users


image

10. Click on Create a new Catalog Group. In the new window give the name of the group and as a best practice give it a password.
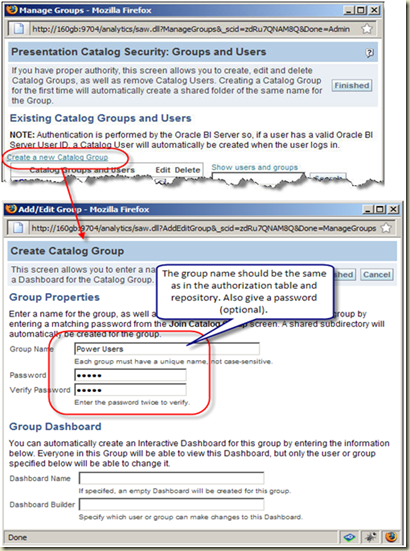
image

11. Now when logged I will log in as Kumar Kambam and click on My Account, in here we can see the Kumar.Kambam ‘s group membership. You can join a Catalog Group from here.
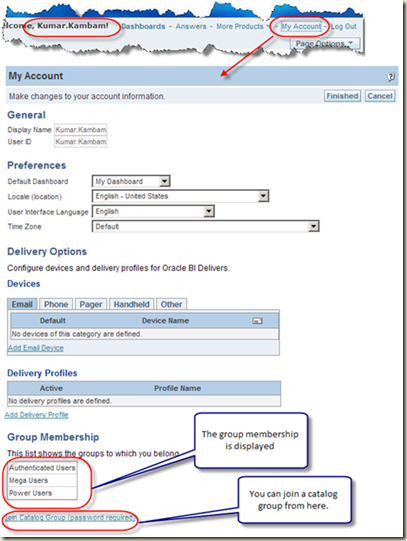
image

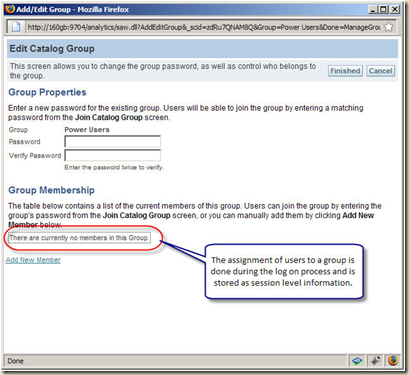
12. Now that we have established that Power Users group has at least one user as demonstrated in the Step 12, let us log in as Administrator and go to Power Users Group properties. Don’t panic if you see the message saying “There are currently no members in this Group”. Group assignment to a user is done at session level. When a user logs on and authorization process assigns groups to users. This assignment of users to a group is valid for that session only. Thus no group membership information is stored in the presentation services.
image

13. One can also create catalog groups in the presentation services and assign users manually, however it is not recommended to do so.

14. One frequently asked question is – Why cannot I see the comprehensive list of users and their group memberships in the presentation services?

In this set up, presentation services cannot be used to maintain or see the comprehensive list of users. A user will appear only after he/she logs on for the firstime. As far as group assigment goes, it is done on the session level and is valid for that session only. So we cannot see the group membership information. Though you can create a catalog group on the presentation services and assign users manually, it not recommended to do so.

Points to ponder

1. Authentication and Authorization are two different processes accomplishing different tasks.

a. Authentication checks valid user and password

b. Authorization assigns security group membership

2. Authorization process is executed after authorization process

3. If you want to control data and web security with the groups defined in the table, the name of the group should be the same in all the three places – table, repository, and presentation services

4. The assignment of a user to a group in this case is done at session level and that information is not stored in the presentation services. Though you can create a catalog group on the presentation services and assign users manually, it not recommended doing so.

Tuesday, June 16, 2009

Configuring user interface behavior in OBIEE

Let's face it, there are some things about the OBIEE interface that just don't sit well with you. For example, you may have noticed that the "Download to Excel" feature actually downloads MHTML, not native XLS, which may or may not be desirable behavior for your users but regardless, it's not the most accurate label for the given behavior.

Say we want to remove the "Download to Excel" link and instead force users to use the "Download to Excel 2000" feature -- and to eliminate any confusion, we want to drop the "2000" and display that option simply as "Download to Excel". Is this doable? How?

Changing the interface to achieve these requirements is doable, and here are the steps we have to take:

  • Drop the original "Download to Excel" link from the Download menu
  • Rename the "Download to Excel 2000" menu item to "Download to Excel"

First we need to understand how to configure the interface behavior. Much (if not all?) of the OBIEE user interface is configurable via a series of XML files:

OracleBI/web/msgdb/messages/*.xml
These files define the HTML (and JavaScript) code used to create the UI for various user controls. They rely on message "variables" for the actual words that users see

OracleBI/web/msgdb/l_*/messages/*.xml
These files assign language-specific message words to the message variables (files in l_en/messages assign message verbiage for English-language configurations, l_es for Spanish, l_de for German, etc)

But before we start messing with these files we need to understand how to modify them in a way that is compatible with an upgrade. Notice in the "OracleBI/web/msgdb" folder there are three "types" of subfolders:

a) language-specific folders (l_ar, l_cs ... l_en, etc),
b) the "/messages" subfolder
c) the "/customMessages" folder

Files in the "/messages" folder have been deployed by the application install process. Any files in the "/messages" folder will be OVERWRITTEN during an application upgrade. If you don't want your custom configurations to be wiped out at upgrade time, here's what you do: copy the desired file that you want to configure into the "/customMessages" folder and make your changes there. The application will automatically use whatever lives in the "/customMessages" folder as the "official" version, overriding the version in the "/messages" folder.

Now the question is, which of the xml files in "/messages" and "/l_en/messages" do we need to configure?

In "/messages", the file in question is called "viewscontrolmessages.xml". Open that up, then save it to "/messages/customMessages." Upon examining this file you'll see that the XML defines a series of "WebMessage" entities. We are interested in the one named "kmsgEVCDownloadLinks", which happens to be the first WebMessage entity. This element contains a series of HTML links whose purpose might not be obvious at first glance. Look closer and you'll see some code that should give us some good clues as to what's going on.

Let's deconstruct the first link as an example:

<a onclick="">Download('@{command}&amp; Format=mht&amp; Extension=.xls'); return false" href="javascript:void(null);"name="SectionElements"><!--xml:namespace prefix = sawm /--><sawm:messageref name="kmsgEVCLinkDownloadExcel"></a>

In the opening tag we see the name of this element ("SectionElements") and a JavaScript "onclick" directive that calls the "Download" subroutine with various parameters, including "Format=mht".

Where we would expect to find the actual verbiage of the link that the user sees -- between the opening and closing anchor tags -- we see a messageRef "token" that refers to an entity named "kmsgEVCLinkDownloadExcel." This is the message variable whose value is set in the language-specific configuration files (which are found in /l_en/messages for my English-language installation).

Hmm, judging from the naming convention it looks like we found the "Download Excel" link. Looking further down the list we see another link referring to the variable "kmsgEVCLinkDownloadExcel2000". I'm going to go out on a limb and say we've found the HTML for the two links that we need to change. Remember we want to remove the first and relabel the second. Let's simply delete the "Download to Excel" entry. The resulting XML should look something like this:

<webmessage name="kmsgEVCDownloadLinks"><!-- Param command --><!-- target is parent so when saving from frameset we dont get access denied error -->[html]<sawm:choose><sawm:when name="noMenu"><a name="SectionElements"><xmp>href="javascript:void(null);" onclick="NQWClearActiveMenu();Download(&#39;@{command}&amp;Format=excel2000&amp;Extension=.xls&#39;); return false"><sawm:messageref name="kmsgEVCLinkDownloadExcel2000"></a>&amp;nbsp;

Notice the "sawm:choose..." conditional -- looks like there are two versions of the Download menu being defined here. Why? We'll have to save that question for another conversation. For now let's just comment out both links to be safe.

The next question is, in which file do we set the value of the message variables? I did a filesystem search for the string "kmsgEVCLinkDownloadExcel2000" in the contents of all files in the /l_en/messages folder... and found the value for this variable is set in the file "viewmessages.xml":

<webmessage name="kmsgEVCLinkDownloadExcel2000">Download to Excel 2000</webmessage>

Now that I have the file, the first thing I want to do is create an upgrade-proof copy for the custom messages the same way I did for the "viewscontrolmessages.xml" file. I don't see a "/customMessages" folder in the "l_en" folder, so I'll have to create one first, then save a copy of "viewmessages.xml" to that folder.

I open the new file, find the "kmsgEVCLinkDownloadExcel2000" variable, and remove the "2000" from the message. The XML now looks like this:

<webmessage name="kmsgEVCLinkDownloadExcel2000">Download to Excel</webmessage>

I save both files (double-checking to make sure I was modifying the "/customMessages" versions) and restart the Presentation server and voila:


What if we want to change the HTML or verbiage of another interface element but we don't have the luxury of knowing which files define the element? Here's a somewhat crude but essentially effective way of doing it: Now that we know where the message verbiage is set, we could simply do another filesystem search in the "/l_en/messages" folder for the file that sets the variable to the verbiage we want to change, then we can search the "/messages" folder to see where that variable is being used.

As always, have fun...


Wednesday, June 10, 2009

Oracle EPM and Essbase 11x Installation Files in 30 Seconds or Less

Here is a quick guide outlining the steps I used to download the Oracle EPM files for an Essbase version 11.1.1.2 installation.

1) Go to Oracle eDelivery (http://edelivery.oracle.com). Provide login information. From the "Media Pack Search" window, select the product pack “Oracle Enterprise Performance Management System” and Platform (ie Windows).

2) This takes you to the page listing the Essbase EPM files for your selection.


3) Here are the EPM files I downloaded for Essbase 11.1.1.2. I added some comments on the left side describing the type of file. Select the "Download" button to download the required zip file(s).


I hope this provides a clear explanation of where to locate the EPM files for Essbase version 11.1.1.2. As Oracle issues updates and new releases, the file names may change but the basic process should remain the same. My next post will provide more details on how to complete the installation.

Friday, June 5, 2009

Column variables in the Narrative or Ticker views

Here's an important trick to remember when using column variables in the Narrative or Ticker views (or elsewhere, such as a Writeback configuration): Variable IDs map to request columns in the order the column was originally added to the request, even if you delete columns along the way.

Try this exercise in the Paint demo repository (or just follow along with your mind's eye) -- Open the Paint subject area and add or remove columns in this order:


add "Market"
remove "Market"
add "Region"
add "Units"
add "District"
add "Dollars"


... the final variable references would look like this (using the @{cN} syntax):
Region = @{c1}
Units = @{c2}
District = @{c3}

Dollars = @{c4}


To illustrate the results, go into the Compound view and add a "Narrative" view, then copy & paste the references into the "Narrative" text box as typed above, inserting a line break after each one (and why not, a line break in the "Row Separator" text box too). The view should look like this:


Click OK and observe the results.


One more subtlety: From here reopen the view for editing. Notice the server translated the @{cN} syntax into the @N syntax:


At this point you can play with formatting, row counts, placement of the view, HTML markup, etc etc -- but I think you get the idea.


Have fun...