Tuesday, December 30, 2008

JAVA SDK for Installing OBIEE 10.1.3.4 on AIX 6.1 64 bits

Recently (week of October 19 2008 to be precise), I was installing OBIEE 10.1.3.4 on AIX 6.1 64 bit and found out that the Java SDK Version requirement is very hard to fulfill. The minimum version requirement according to the documentation is 1.5.x, so I installed one and ran the UnixChk.sh and it gave thumbs up. After which I have begun the installation process. The GUI pops up; I do all the steps until where it verifies the components it is going to install. I click next it briefly (<1sec) shows the status bar and then the status bar in the installer window disappears but the installer window will remain open (I wish I made some screenshots). I let it be for more than an hour and had to kill it. I looked at the OracleBI and OracleBIData directories and they are empty –this is the case before and after I killed the process.

I then started the installation in console mode. Ran UnixChk.sh everything is fine as shown in the screenshot bellow

clip_image002

Then I started the installation process…

clip_image004

… and the wait is forever.

I then tried other versions of Java SDK and it did not make any difference.

After a while, found out on the metalink that this is a known bug (Bug 7389678: OBIEE 10.1.3.4 INSTALL HANGS ON AIX USING IBM JDK 1.5 - JAVA COMPATIBILITY ISSUE). Then started other set of problems…. First off there was no link to download the version of SDK that the engineering provided to the other client. Then while trying to raise a SR, neither the AIX 6 nor OBIEE 10.1.3.4 are shown under the respective drop downs. So was forced to choose AIX5.1 and 10.1.3.3, and this confused the support. Therefore, after a few calls and a couple of days later, we finally got THE SDK to successfully complete the installation. You can download the 64 bit Java 5 SDK for OBIEE here (Megaupload) or here (Rapidshare).

Monday, December 29, 2008

OBIEE and Virtual Private Database (VPD)

What is VPD?

Virtual Private Database is Oracle’s fine grain access control (FGAC) feature that was introduced in Oracle 8i. It helps control data level security on the database side by applying policies, thus data level security in the applications that read from the database is not necessary. The advantage is that if there are multiple applications accessing data from a database, it is not necessary to implement data level security in all those applications.

How does VPD work?

Policies are created in the database that would append a predicate (a WHERE clause) to the query in runtime. Consider a simple example – there exists a policy which would return only the rows attached to a particular user id on the table Orders. If a user “Kumar” were to query data from Orders table, Kumar would enter the following command:

Select * from Orders;

The policy that dictates what information a user can see would append a predicate to the query as follows:

Select * from Orders

where user_name = ‘KUMAR’;

This mechanism of appending the predicate is entirely transparent to the user.

Click here to read more about VPD on Oracle’s OTN.

Configuring VPD in OBIEE

To use the VPD feature in the Database and OBIEE along with its caching capabilities it is important to configure VPD in OBIEE. Failing to configure VPD in OBIEE while caching is enabled (in OBIEE), the request would bypass VPD policies by accessing data from cache and data level security will not be effectively handled by the database’s VPD. Thus, the users will see incorrect results.

To configure VPD in OBIEE, first enable the VPD option in the database’s general tab as shown:

clip_image002[7]

Then enable the “Security Sensitive” option in the security variable:

clip_image004[4]

Normal OBIEE Cache Behavior

To be simple and brief, if caching is enabled, a query that is being run for the first time would create a cache. Subsequent requests that is similar to the query or its subset would hit the cache to retrieve the results. This is true even if the users are different.

Example:

Logged on as Kumar Kambam

clip_image006[6]

Running a request…

clip_image008[6]

… generates the following Query log

clip_image010[6]

The cache is created….

clip_image012[6]

Now any user that issues a similar request or a subset of the request will hit the cache.

Logged on as Power User1

clip_image014[6]

Running a similar request, generates the following log. Notice that OBIEE server found a matching query in the cache that is created by Kumar.Kambam for the query issued by Poweruser1.

clip_image016[6]

clip_image018[6]

OBIEE Cache Behavior with VPD configured

When VPD option is configured in OBIEE, cache is created for each user even though a matching query exists in the cache. This ensures that the data retrieved for a user is not retrieved from the cache created by a different user, thereby ensuring the enforcement of VPD policies. In other words, if Kumar.Kambam were to run a query, the cache is created by the data visibility rules enforced by the VPD for Kumar.Kambam. If Poweruser1 runs a similar request it should bypass the query cache and hit the database to retrieve the data along the policies of the VPD for Poweruser1; if it were to hit the cache created by Kumar.Kambam, the results for Kumar Kambam will be presented to Poweruser1.

After configuring VPD, logged on as Kumar Kambam

clip_image019[4]

Running a query for the first time…

clip_image021[4]

…the following log is generated

clip_image023[4]

The cache is created

clip_image025[6]

Running the same query again, the following log is generated…

clip_image027[6]

OBIEE found a matching query in the cache and uses it.

clip_image029[6]

Now log on as Power User1

clip_image030[4]

By running the same request, the following log is generated…

clip_image032[4]

A new cache entry is created even though a similar request has been issued by a different user and a cache has been created for it

clip_image034[4]

The subsequent requests by Poweruser1 that is similar to the query will hit its own cache. This ensures that a user will only see his/her data.

CACHE MANAGEMENT

Databases are periodically refreshed with updated data due to ETL (Extract-Transform-Load) processes being executed. This will cause the information that is stored in the query cache to become outdated, or ‘stale’. OBIEE Administrators must enable a method of purging and refreshing the cache on a continuous basis.


IT TAKES MONEY TO MAKE CACHE

There is a cost associated with utilizing cache. This cost comes in the form of disk space for storage, purge transactions on the server, and administration. However, all the costs itemized above are easily outweighed by the decreased response times and increased performance gained by the application.


SOME CACHE IS WORTH MORE THAN OTHER CACHE

Not all data sets are treated the same. Although caching is set as a default within OBIEE, some queries may not be a suitable use of the cache.

Situations in which queries return an extra-large amount of data may not be ideal because the extra-large data set will also cause the cache file to be extra-large as well. The larger the cache, the less performance enhancement can be derived from the cache. A general rule-of-thumb is that a direct database hit should be sought with queries that will generate more than a 1GB cache entry.

Situations in which particular data elements must be refreshed frequently, or on a near real-time basis, may not be good candidates for a caching solution. Depending on your requirements, there may be a threshold for which the performance advantage of cache can be trumped by the frequency at which the cached data will need to be purged and refreshed.


OPEN YOUR CACHE PLAN

1. Make a decision to either (a) start with cache enabled for the application... or (b) use cache only as a peformance tuning tool following initial development.

2. Then.. develop a cache updating method

3. On an ongoing basis, monitor query requests to identify opportunities for improvement


CACHE METHODS

The important hurdle to overcome when implementing a cache solution is to eliminate the opportunity for data latency, or ‘stale’ data to exist. ‘Stale’ data will exist when the cached data is not purged after the ETL process has updated the data warehouse.

1. No Cache Method
2. Manually Administered Cache Method
3. Table Level Caching Method
4. Polling Table Reference Method


No Cache Method –

A new SQL query will call the database every time a request for data is generated from the users. This will greatly affect system performance and user productivity because of the increased network traffic and demands on the server.

The system will only be as good (or fast) as its weakest link. If the network connection is slow or the database is slow returning results… the users will feel this pain with slow response times.


Manually Administered Cache Method --

When connected in to a repository within online mode, a cache manager utility is available from Manage>Cache. Note that this option may be unavailable if you have disabled caching in the NQSConfig.ini file.

Manual cache management is best served as a useful utility during testing phases. It is generally not a dependable option for daily operations as it requires the ad-hoc purging of the cache by a user.


Polling Table Reference Method –

The system can identify when to refresh cached data with the use of a polling table, better known as an event table. The event table contains timing information about specific events that occur. When an ETL process is executed, an event table in the database is updated with an entry recording the details of a data table when that data table is updated by the ETL process. The BI Server can poll the event table and purge the data from the cache if a data table has been updated.

The frequency with which the BI Server checks the polling table can be set to coincide with that of the ETL so data from the more frequently updated tables is purged from the cache more often to avoid ‘stale’, or out-of-date’, data.

The polling table method can serve to be most useful where incremental ETL processes run during the day. An example of this would be to update transaction or sales data.

The polling table method is not as beneficial when the incremental ETL is run once a day or overnight.

Frequency settings for which the BI Server polls the event table is set in the OBIEE Administration tool, Tools>Utilities>Oracle BI Event Tables. Note that the parameters for the event table contain table names only and cannot contain an alias. This can lead to misleading results and an alternative purging strategy must be found for the alias.


Table Level Method –

The simplest description of this cache method is to manage caching on a table-by-table basis. All tables have caching enabled by default. The default amount of time data is left in cache (called persistence time) is infinite.

The best combination of performance improvement and storage space conservation can be achieved by deselecting tables from this process that are rarely queried. The modification of persistence time to coincide with the incremental ETL processes (similar to the Polling Table Reference Method) can also further increase performance.

Building Calculations in Oracle BI Pivot Tables

Recently, I ran into a situation with designing a report to appear exactly like an Excel spreadsheet that our client's finance department used for years. Using the pivot table view, I was able to mimic 90% of the Excel spreadsheet. The remaining 10% that remained incomplete was creating group subtotals and grand totals. A colleague of mine, Kevin McGinley, an individual known for his dashboard prowess, suggested creating the pivot table report by building out each row calculation using the option "New Calculated Item," which can be found by clicking on the More Options button in the column.


Following the advice of my colleague, I was able to mimic the Excel spreadsheet 100%.

To build a calculation for an item in an Oracle BI pivot table, you need to do the following:

1. In the Pages, Sections, Rows, or Columns area, click the More Options button for the measure on which you want a calculation performed.

2. Select the option New Calculated Item. The Calculated Item window appears.

3. Assign a name for the calculation in the Name field.

4. To build a formula, choose the Formula function.
  • NOTE: A formula creates a dynamic custom grouping within the pivot table. All measures references in a formula must be from the same logical column and must be present in the results. Formulas can be inserted into, or combined with, other calculations.
The mathematical operators become visible. The operators are shown in the following table.

+ Plus sign, for an addition operation in the formula.
- Minus sign, for a multiplication operation in the formula.
/ Divide by sign, for a division operation in the formula.
$ Dollar sign, for acting upon the row position of an item in a formula.
( Open parenthesis, to signify the beginning of a group operation in the formula.
) Close parenthesis, to signify the ending of a group operation in a formula.

  • In the Function field, build the formula by typing or clicking measure names, and clicking operators to insert them into the formula.
  • Use parentheses where appropriate.

5. When the calculation is complete, click Finished.

Keep in mind that this option isn't perfect. In fact, the main drawback is that each calculated row CANNOT be moved up and down the list of calculated items. If you've created 25 new calculated items and forgot to create an item that should be located at the 10th spot, then you'll have to recreate ALL of the calculated items after #10.

Another draw back that I have encountered is that if your column formulas contain calculations, those calculations may or may not work correctly. This example is more specific to the situation that I encountered and may not apply, but take notice.

The alternative to doing this is building union queries using "Combine with Similiar Request" option in Criteria. In my particular situation, union queries was not an option because there would be too many queries and performance would have suffered significantly.

Wednesday, December 10, 2008

Dashboard Navigation Tips

Some common designs for Dashboard navigation include:
  1. Spreading content across Dashboard pages and letting the user navigate to each page
  2. Linking Dashboards to specific reports
  3. Linking Dashboard pages to other Dashboard pages (sometimes to hidden pages in the same Dashboard)
These are just some of the options, but when deciding which is best, there are a few things to consider. First off, I prefer option 2 (linking Dashboards to Reports) as opposed to Option 3 (linking Dashboards to Dashboards), simply because OBIEE will automatically create a "Return" link on the target Report, whereas no such link will appear on a target Dashboard. This link allows the user to navigate back to the original Dashboard with all of the prompts set (i.e. the original source page contains the user's settings, not the defaults). I am not aware of any easy way to achieve this same return navigation for a target Dashboard. Of course the user could press the browser's back button to return to the original Dashboard, but this method seems to have unpredictable and sometimes incomplete results (for example, in some IE browsers users have experienced issues when using the back button whereby charts do not display or other data "freezes", so the back button is definitely not the preferred method).

Either way, when implementing option 2 or 3, I often use Navigation Targets (these are set under Column Heading Interaction or Value Interaction in the Column Properties). Navigation Targets are useful because they allow you to link from a source Dashboard/Report to another target Dashboard/Report and this type of navigation also passes prompt values from the source to the target. Passing prompt values is the default behavior and I am not aware of any way to turn this off; however, there is a nice trick to avoid this behavior if you do not want the source prompt values to override filters in the target - the trick is, for any prompted column that the source and target have in common and that should not have prompt values passed, simply create a duplicate presentation column with the same name (and logical mapping) and place it under a different presentation folder. For example, if my source Dashboard contains a prompted column called Year, and so does my target report, but I want my target report to always contain a hardcoded filter of Year = 2008, then simply create a duplicate Year column in the presentation layer and place it under a different presentation folder (sometimes I create a folder called "FOR DEVELOPER USE ONLY" and set its permissions to hide it from front end users). Set the source report to use the original Year column and the target report to use the duplicate Year column. Even though the column names are the same in the source and target, OBIEE will recognize these columns as distinct since they are in different folders, and therefore, the source prompt value will not override the target filter (and this is seemless to the end user).

One last tip - be careful with Navigation Targets because 1) I find that their behavior is not always intuitive to the end user, especially when linked from charts and 2) be aware that if you use Value Interaction with Navigation Targets, then the actual value that a user clicks on will be passed to the target as part of the filter criteria. If you simply want to provide a text link from a source to a target without passing prompt values, then you can use basic HTML and a hardcoded URL for the target report/Dashboard. However, if you want to provide a text link (as opposed to a Navigation Target embedded in a table/chart), and you DO want to pass prompt values, then you could actually accomplish this with another trick - you can still use Navigation Targets but just create a dummy report, with one real colum and one dummy column. Hide the real column and design the report so that it only returns one row. Also hide the column headings. Then create a Navigation Target under the Value Interaction for the dummy column. Set the dummy column to a constant, such as a description of the target. The final result which displays on the dashboard just resembles a regular text link but it contains the OBIEE built-in Navigation Target functionality which will link to the target and pass the prompt values, so you get the best of both worlds!

Wednesday, November 19, 2008

Branding - LESS is MORE

Experience has shown me that, when people start learning how to change skins and style attributes in OBIEE, they tend to go overboard. There are literally thousands of Cascading Style Sheet elements that make OBIEE look and feel the way it does.

Additionally, it’s extremely difficult to locate certain elements, and many times you end up resorting to a trial and error strategy. I think once someone discovers an element where they can change a text font, or modify a background color, they do it.


Eventually, someone really digging into these skins and style sheets are going to come across a whole list of changes they can make… and they will probably make them. My thought is that, just because something can be changed, doesn’t mean that it should be changed.

With that said, here are some guidelines to follow when attempting to brand OBIEE:
  • Identify an inspiration source (company website, intranet, presentation template, etc…)

  • Create a color scheme before starting the branding process… stick with it (or as close as you can)

  • Follow the leader. There is no need to re-invent the wheel. Try to change existing colors verses introducing colors where they don’t belong.

  • Keep a neutral backdrop. It’s ok to leave white space on the screen… Google is a great example.

  • Many skins/style changes will effect more than one element in OBIEE… beware!

  • Periodically save a copy of the skins/styles folders as you go. Keep multiple versions on file so you can revert back to them any point in the design process. (ex. s_ver1, s_ver2, s_ver3, etc…)

  • Be creative and experiment… just don’t go overboard

These are simply guidelines and not meant to be rules since branding is a creative process. Just keep in mind that this is something everyone in your organization has to look at and use on a daily basis. It’s probably a good idea to get a second opinion at checkpoints during the design process. But try to limit the amount of input, as too many ideas can become overwhelming.

For additional assistance with branding, visit BI Consulting Group’s website. There is an entire service offering dedicated specifically to Branding OBIEE called Identity. They have even developed a tool to help identify certain style elements, and where to change each setting.

Thursday, November 13, 2008

Branding - Dashboard Page Tabs

One of the most dramatic changes you can make to the dashboard design is the Page Tab color. In my opinion, this is where you really start geting the impression you’re working with a truly customized version of the software. I say this assuming there has already been a significant amount of customization done on the dashboard header. There has to be some level of congruence maintained. Modifying the page tabs, without a previously customizing the header to match would make it seem awkward and out of place.


Unfortunately, it’s not a simple process. There are multiple image files that need to be changed, consistencies that need to be maintained between these image files, and a handful of HTML modifications to go with it.
Fortunately, I know exactly what needs to be done… and plan to share it with you now.

Before you begin, you’ll need to choose a color for your “selected” an “not-selected” tabs. I suggest sticking with the “out of the box” theme of having your selected tab the same tone, but a slightly darker shade than the unselected tabs. Each tab (selected and not-selected) is made up of 2 images each, making a total of 4 image modification necessary to complete this task. Be sure to make copies of the original image files so you can revert back in the event of a mistake.

1. Open the file “bg_tab.gif” using an image editing software like Photoshop, or Fireworks.

2. Adjust the Hue, Contrast, and Lightness settings until you achieve your desired “Selected” tab color (be sure to document the exact setting adjustments as you’ll need them in the next step. Save the file.

3. Open the file “subtabr.gif” and apply the EXACT same setting adjustments made in step 2. Save the file.

4. Repeat steps 1-3 with the files “bg_dim_tab.gif” and “subdimtabr.gif” using the “Not-Selected” tab color you’ve already chosen.

5. To change the text color within the Selected tab, you’ll need to adjust the HEX color code (“color: #XXXXXX;”) within the file “PortalContent.css”, for the label - TabHiFont

6. To change the text color within the Not-Selected tabs, you’ll need to adjust the HEX color code (color: #XXXXXX;) within the file “PortalContent.css”, for the following labels:

TabDimFont:link

TabDimFont:visited

TabDimFont:hover

I suggest choosing a text color slightly less bold than the “Selected” tab text color. I also recommend choosing a different color to utilize the hover functionality. Choose either Black (#000000) or white (#ffffff) for the label “TabDimFont:hover”

The final task is to set the color of the Tab Line to match the darkest color of the “Selected” tab. The goal here is to make the bottom color of the “Selected” tab seamlessly blend into the tab line.

7. Open the file “bg_tab.gif” you modified in step 2. Identify the HEX color code of tab at its bottom most point. Remember this code.

8. Open the file “PortalContent.css”, and find the entry “TabLineCell”. Edit the entry to look just like the example shown here, with “XXXXXX” being the HEX color code you identified in step 5.

.TabLineCell {background-color: #XXXXXX;}

9. Refresh your browser to see the changes… make adjustments if needed.

You may need to repeat steps 1 – 6 a few times until you achieve the exact feel you’re looking for. Just for fun, play around with making the “Selected” tabs a completely different color than your “Not-selected” tabs, or vice versa. You’ll be amazed at the difference it’ll make.


If you really feel ambitious… you can do the same to the 'Answers' and 'Delivers' Page Tabs and style settings. Realistically, it isn’t feasible for a do-it-yourself-er to spend the time to identify each individual setting and redesign every detail. It would probably take months… or even years just to find everything.

Some consulting firms who implement OBIEE will do a certain level of branding, if requested. BI Consulting Group advertises a service specific to branding called IDENTITY. They have even developed a tool that pinpoints and links to each of the 20+ CSS files where the bulk of these changes are made.

Check back for future updates where I’ll cover steps on customizing other areas of OBIEE.

Tuesday, November 11, 2008

Oracle BI Techology Day -- St. Paul (Free Event)


Oracle is conducting a free Technology Day with a focus on business intelligence. The BI Tech Day is set for Tuesday, December 9th in Saint Paul, MN. If you have plans to be in the area, this is a must-see half-day event.

Two tech sessions are scheduled to follow a keynote titled, "Drive Greater Business Insight Across Your Enterprise". The final closing session, titled "Building the Foundation for a Corporate BI Strategy", is being conducted by BI Consulting Group.

If your a sports fan, one of the really cool parts of this event is the free tour of the Xcel Energy Center. The arena is home to the Minnesota Wild and was named "Best Stadium Experience" by ESPN The Magazine.

The event is FREE, FREE, FREE. Click here to register online or call 1.800.820.5592 ext 5721.

Data Modeling Continued... Kimball vs. Inmon: The Basics

As I discussed last time, many in the field of BI are strongly sided with the methodology of either Ralph Kimball or Richard Inmon. As mentioned last week, there are more similarities than differences, but today I'll just point out the main differences between their philosophies for anyone unfamiliar with them.

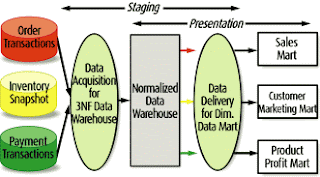
The main difference is that Kimball's architecture, also known as the Bus Architecture, is based on loading individual data marts directly from the operational system through the data staging area using conformed dimensions. An operational data store or intermediate data structure may or may not be necessary depending on existing data sources and business requirements. In this design, what is referred to as the data warehouse is actually just the collection of data marts. Kimball's basic architecture is shown in the diagram to the left. Inmon argues that this approach is inflexible without a centralized warehouse and changes cannot be made as gracefully as with his approach, which is explained below.

Inmon's Corporate Information Factory, or CIF architecture, is based on the idea that a complete data warehouse should be created in third normal form. Data marts are then created separately using the warehouse as their source. These data marts can be denormalized as the designers see fit, often into a star schema. This architecture is depicted in the diagram below.Those in Kimball's camp argue that the design, implementation, and maintenance of this data warehouse, along with its associated additional ETL processes, are often unnecessary and take much more time to get off the ground than projects using the BUS archeticture.

The differences and arguments between these two approaches go far beyond what I've mentioned here, but this should help to explain the basic split between the methodologies. I've read many of the arguments for both sides out there, and although there are plenty of hard liners in both camps, the verdict seems to be that the answer to which architecture is better is....it depends. Yes, boring I know, but I've read many comments by designers claiming that they have either used hybrids or, used both successfully at different times depending on the existing architecture and business requirements.

For every opinion I've read advocating one or the other, I read another praising the merits of both. I also read one claiming that Richard (not Ralph) Kimball's methodology is superior, which made me laugh, because I made the same mistake once in conversation shortly after learning his name. My colleagues somehow seemed skeptical that the fictional character from the movie "The Fugitive" has his own data warehouse methodology.

Hopefully this helped explain the main differences to anyone new to their methodologies. As I mentioned in the preceding post, I encourage anyone involved with a BI project at any level to pick up a book by both men to fully understand their ideas. Also, although this topic has already been argued at length, I encourage comments from anyone with significant experience using either or both methodologies.

Friday, October 31, 2008

Data Modeling

One of the most important aspects of a BI project is the underlying data warehouse model. This may seem like a no-brainer, right?

In practice, I don't believe the data model is always given the proper time or expertise necessary for a successful implementation. Often, seemingly small flaws or shortcuts in the design of data warehouses or marts can cause much larger problems down the road in terms of functionality, performance, and flexibility. It's imperative that any organization faced with the task of designing their own data warehouse has a project team that understands the importance of a well-planned dimensional model. Changes can always be made, but often at an exponentially higher cost when issues are uncovered late in the game.

Anyone involved with a BI project at any level without a sound understanding of data warehouse modeling techniques should consider doing some research on the topic. One book in particular which I highly recommend is The Data Warehouse Toolkit, 2nd Ed. by Ralph Kimball and Margy Ross. If you're unfamiliar with Ralph Kimball, he's considered a pioneer in the field of data warehousing.


Another highly regarded data warehouse guru is BIll Inmon, who has also written several books on the subject. Most experts in the field strongly side with either Kimball or Inmon. There have been many arguments around whose philosophy on the subject is superior, but of course I'd hate to go picking a fight in my first post by endorsing one over the other here. Maybe we'll hit the topic of their fundamental differences next time. In actuality, their methodologies are very similar and have become more so over time. Anyone interested in learning more about warehouse design should pick up a book on the subject by either or both of them.

An understanding of their techniques and a well designed warehouse won't guarantee a successful implementation, but it's a great step in the right direction. Obviously, we'll never be able to foresee every issue to arise or every request thrown at us, but a strong warehouse design will allow us to deal with both much more easily.

Thursday, October 30, 2008

Basic Branding - Dashboard Header... Continued

In my last Blog… I outlined the steps necessary to update your header image and dashboard links. Here we will update the product link color, welcome bar background color, dashboard name color, the welcome text color.


Whenever you’re making additional color changes to the header, or anywhere else in the software, keep your company color palette in mind. Pull colors from the company logo or an already header image whenever possible. So without further ado… we begin:

1. Identify a desired color and HEX color code for the welcome bar. The welcome bar is the area directly under the dashboard header image and sits behind the page tabs. This color should complement the existing header image.

2. The welcome bar has two color settings… so first open the file “PortalContent.css” and find the entry “TabTable”. Replace the existing “background-color“ HEX code with the one you identified in step 1.

3. Now open the file “PortalBanner.css” and find the entry “PortalBottomTable”. Replace the existing background-color HEX code just like step 2.

4. To change the dashboard name text color, open the file “PortalBanner.css” and find the entry “PortalName”. Replace the HEX code for “color” with one of your choice.

5. Within the file “PortalBanner.css”, do the same thing for the entry “WelcomeTextCell” to change the color of the welcome message.

6. To update the product links, find the following entries within the file “PortalBanner.css”:

a. .DashBarProductCell A,
.DashBarProductCell A:visited,
.DashBarProductCell A:link

b. .DashBarActiveProductCell A,
.DashBarActiveProductCell A:visited,
.DashBarActiveProductCell A:link

c. .DashBarActionCell A,
.DashBarActionCell A:visited,
.DashBarActionCell A:link

d. .DashBarProductCell A:hover,
.DashBarActiveProductCell A:hover,
.DashBarActionCell A:hover,
.DashBarAlertCell A:hover

e. DashBarSep

7. For each of these entries, with the exception of “DashBarSep”, you will need to add an attribute named “color” between the “{…}”. It should look like the following with “XXXXXX” being your desired HEX color code.
color: #XXXXXX;

…for entries with the color attribute already existing, simply replace the HEX code.

8. Refresh your browser to see the changes… make adjustments if needed.


You are now one step further to achieving a completely customized OBIEE. A completely branded style would include customized colors and images for:

  • each page tab
  • welcome text
  • product links
  • section colors
  • table and pivot table colors
  • chart colors
  • ...and the list goes on and on.


If you really feel ambitious… you can do the same to the 'Answers' and 'Delivers' areas of the software. Realistically, it isn’t feasible for a do-it-yourself-er to spend the time to identify each individual setting and redesign every detail. It would probably take months… or even years just to find everything.

Some consulting firms who implement OBIEE will do a certain level of branding, if requested. BI Consulting Group advertises a service specific to branding called IDENTITY. They have even developed a tool that pinpoints and links to each of the 20+ CSS files where the bulk of these changes are made.

Check back for future updates where I’ll cover steps on customizing other areas of OBIEE.

Tuesday, October 21, 2008

Basic Branding - Dashboard Header

There’s a lot of talk… and confusion... surrounding the topic of branding OBIEE. There obviously isn’t much in regards to documentation as Oracle doesn’t make it a priority to show companies how to erase the Oracle name from their own product. But since I don’t really care about any of that… I’ll share some of what I know.

I’m going to outline a few simple steps you can use to change your OBIEE dashboard header. Keep in mind that this is just one of many steps required to achieve a completely branded environment. The following is a step by step guide designed to get you started:


1. Open the image file bg_header.jpg using an image editing software like Photoshop, or Fireworks. In 10.1.3.3, the location is within \OracleBI\web\app\res\s_oracle10\b_mozilla_4.

2. Modify the image as desired, but be sure to maintain the image size. I also recommend using a similar layout as the original image, as the dashboard links tend to get lost if the logo or background image is too busy. You can also crop screenshots from your company website to capture certain designs or themes.

3. Save or export this file with the same name (bg_header.jpg). Save a copy of the orginial file under a different name to revert back to if needed.

4. Depending on the color of you new header, you may need to change the color of the dashboard links located at the top center of the header. Using the Image editing software, identify the HEX code for your desired color. (white = FFFFFF, Black = 000000)

5. Open the file PortalBanner.css, and find the following entries:
  • PortalLink:visited
  • PortalLink:hover
  • PortalLink:link
  • PortalLink:active
  • CurrentPortal:link/visited/hover


6. Each of these 5 entries will have an attribute listed under names “color”. Each entry is displayed depending on the link status (visited, hover, current…etc.). The default color is the same for each situation, but you can play with these setting if you want. All you need to do is insert your new color code in place of the existing one.

7. Refresh your browser to see the changes… make adjustments if needed.


You have now completed the most basic tasks needed to brand your version of OBIEE. A completely branded style would include customized colors and images for:

  • each page tab
  • welcome text
  • product links
  • section colors
  • table and pivot table colors
  • chart colors
  • ...and the list goes on and on.


If you really feel ambitious… you can do the same to the 'Answers' and 'Delivers' areas of the software. Realistically, it isn’t feasible for a do-it-yourself-er to spend the time to identify each individual setting and redesign every detail. It would probably take months… or even years just to find everything.

Some consulting firms who implement OBIEE will do a certain level of branding, if requested. BI Consulting Group advertises a service specific to branding called IDENTITY. They have even developed a tool that pinpoints and links to each of the 20+ CSS files where the bulk of these changes are made.

Check back for future updates where I’ll cover steps on customizing other areas of OBIEE.

Thursday, October 16, 2008

Performance Testing

I recently picked up a book titled "Troubleshooting Oracle Performance", which covers methods for tuning SQL and the Oracle DB versions 9iR2 through 11gR1. I have only read a few chapters to this point, but it appears to contain some useful information. One interesting point it makes in these early chapters is that many IT projects (BI implementations included) fail to define specific performance requirements (or SLA's) in addition to the functional requirements. In some instances, performance does not ever become an issue after implementation, but far too often, performance is not adequately tested during the test phases, and performance issues are not encountered until the application is already in production. This point is easy to ignore (until it occurs in production and it's too late), but poor performance can have the same damaging effect as functional defects on the overall user adoption of an application, and therefore performance testing should be given equal consideration as functional testing - this point is just something to think about which bares repeating every now and then.

Wednesday, October 8, 2008

The Six Guiding Principles of Dashboard Design

Most of the best practices standards we’ve provided, once learned, can be quickly implemented on each new dashboard created. Others will take some practice, but all have been proven in production implementations, each of which have received overwhelming user acceptance. Our advice is to avoid the approach of “getting something out the door” and then going back later to apply best practices; instead, we recommend using these standards and best practices from the very start with the first release. The fact is, once you’ve learned the ideas in this document (in particular our section on “Shortcuts, Cheats and Other Tips & Tricks”), you’ll discover that you can build a powerful, flexible, and aesthetically pleasing report in the same time it takes to build a clumsy, static, low-functionality report.

There are six main Tenets of good Dashboard Design best practices and are as follows:

I. Provide insight, not reports.
When a key user drops off a stack of Excel spreadsheets in response to your request for “requirements”, take the time to understand what results they are trying to derive from that content. Understand what they search for, what they mark up with a yellow highlighter, and what they look at next after discovering an exception. With the best practices that follow, you’ll discover that you can offer multiple ways of providing insight from the same content packed into one Excel spreadsheet (which offered no insight, just data); and that you’ll be able to compact multiple Excel spreadsheets into a single, flexible report module that can fit into the upper left hand corner of a dashboard. Column selectors, view selectors, and bubble charts are not complex. If you think they are, see Tenet #3.

II. Protect your real estate and eliminate the white space.
Unlike printed reports where you can get away with saying “the answer is on page 42”, the same is not true for online dashboards where you will most likely be restricted to what you can fit into an 1024 x 768 pixel screen (or 1024 x 2304 if your dashboard is three pages long). If your users can’t derive insight in the first few seconds of looking at a dashboard, the design could use improvement. If your dashboard has large patches of white space, it will look incomplete to the users and you are wasting space. If you believe that it’s impossible to fit meaningful content into 1024 x 2304 pixels, go check out popular Internet portals like MyYahoo, Google, or MSN.

III. Trust your users will get it.
Most users in today’s business world are familiar with browsing the web and the typical controls used to shop, bank, research, and consume information. Controls like dropdowns, buttons, checkboxes, and text fields are all used on popular sites throughout the Internet – and on OBIEE, too! Trust your users. If you’ve followed rules #1 and #2, your users are going to get it.

IV. Merge business skills into your IT skills.
In order to create the insightful reports we discussed in Tenet #1, report designers need to know more than what the business users are asking for on a report. A highly successful BI project will have designers who know the business side well and can develop new reports and enhance existing ones without explicit instruction from the business users. In Business Intelligence, we need to move away from simply asking what the user wants the report to look like and what data they want in the database. We need to move toward understanding the business processes and determining what data and reports will bring the insight the users need. Once you’ve gotten to know the processes driving the reports, you can make suggestions to the users on what they need to be successful. Most of your users have no idea what kind of reports Oracle BI is capable of producing when utilized to its full potential. With a time spent getting to better know the business, you’ll be able to deliver powerful, insightful reports the users hadn’t considered or didn’t even know were possible.

V. Design your dashboard (and insight) in Oracle BI itself using an iterative methodology.
Dashboard design requires multiple iterations to be successful. Business users often don’t know or realize what they want until they can see something they like or something they recognize needs to be changed. It’s important that you have a plan in place during the build process that allows for several levels of refinement. This plan should include a sound strategy for capturing and documenting user input, prioritizing the changes, and determining the complexity. Careful planning of this process will ensure that all iterations run smoothly and add as much value as possible.

VI. Be prepared to review, refine, and re-do.
After you’ve rolled out your BI project, if the implementation is viewed as a success by the users, you’ll notice that BI slowly becomes more pervasive throughout your organization and is eventually no longer thought of as BI - it’s simply part of the way the business is run. But the business focus can change, processes change, needs change. A periodic review should be done to asses whether the dashboards are still meeting the needs of the business as well as when they were first deployed. Refinement may be needed to evolve the dashboards with the business, and sometimes even more dramatic re-do’s are necessary.

Tuesday, October 7, 2008

Cache Basics

Part of any OBIEE Implementation should be spent defining the proper caching strategy specific to a given project. This post is a basic look at what cache means to OBIEE.

WHAT IS CACHE?
Pronounced "cash", it is generally an easily accessible place to store frequently used information. The most recognizable use of cache relates to the manner in which a personal computer utilizes this information. As it relates to PC, there are two basic types of cache: memory caching and disk caching.

Both types follow the same principle of storing recent or frequently used information in a memory buffer. Memory cache uses a portion of static RAM memory. Disk caching uses conventional main memory. When a piece of information is required, the system (or application) first checks the cache to see if the data is there.

The main purpose of cache is to improve performance. Accessing information stored in a memory buffer can be thousands of times faster than accessing a byte on a hard disk.

OBIEE CACHE
Caching as it relates to OBIEE is a bit different, but the same general purpose applies. Rather than utilizing memory buffer to quickly access recent information, OBIEE will access a file containing a stored record set of information rather than spend processing time querying the database upon each request.

When a request, or query, is made for a set of records, OBIEE can store this as cached information in a file to be used later. When a similar request is made for this same information, OBIEE will retrieve this information from the cache rather than spending processing time negotiating with the database. This can greatly improve the performance of the application.

In the OBIEE/Siebel Analytics world, this is referred to this as ‘query cache’. By utilizing query cache, the cost of database processing only needs to be paid for the one time the query is run against the database. Subsequent identical queries will run against the cache.

Monday, October 6, 2008

"Bullet Proof" SSO

The following pieces are a subset of info presented at Oracle OpenWorld's OBI SSO Unconference by Kevin McGinley and myself. The content framework was provided by John Andrzejek of BI Consulting Group.

The full presentation can be found via http://www.biconsultinggroup.com/OOW

Many organizations have enabled SSO (Single Sign-On) with OBI EE; however, not all have taken the appropriate steps to make it "Bullet Proof", aka next to impossible to hack. Until now!

Below is a typical OBI EE login path when SSO is not enabled. This method works well in an intranet environment where personal data is not available to be queried by OBI EE.


Many organizations have taken the step to enable SSO for OBI EE so their users do not have to enter/remember yet another username/password combination. SSO is more secure than the basic OBI EE login but is still susceptable to hackers tricking OBI EE into authorization.


In order to ensure a more robust/secure method of SSO with OBI EE, the following approach should be taken so that a hacker cannot trick OBI EE into thinking the user has been authenticated. This is handle by Step 4 (see pic below) whereby the user clicks on a link in their portal to go to OBIEE and the portal writes a Record to a database table and then the BI Server checks this record to make sure the user has been authenticated.

If the user was not properly authenticated by the Portal then OBI will deny the user access to OBI EE.